Toucan AI
Toucan is an embedded analytics platform that enables SaaS product teams to integrate fully customizable, white-label analytics directly into their applications in days, not months. Toucan AI is the next generation of the platform: rebuilt from scratch, AI-native, around a conversational experience.
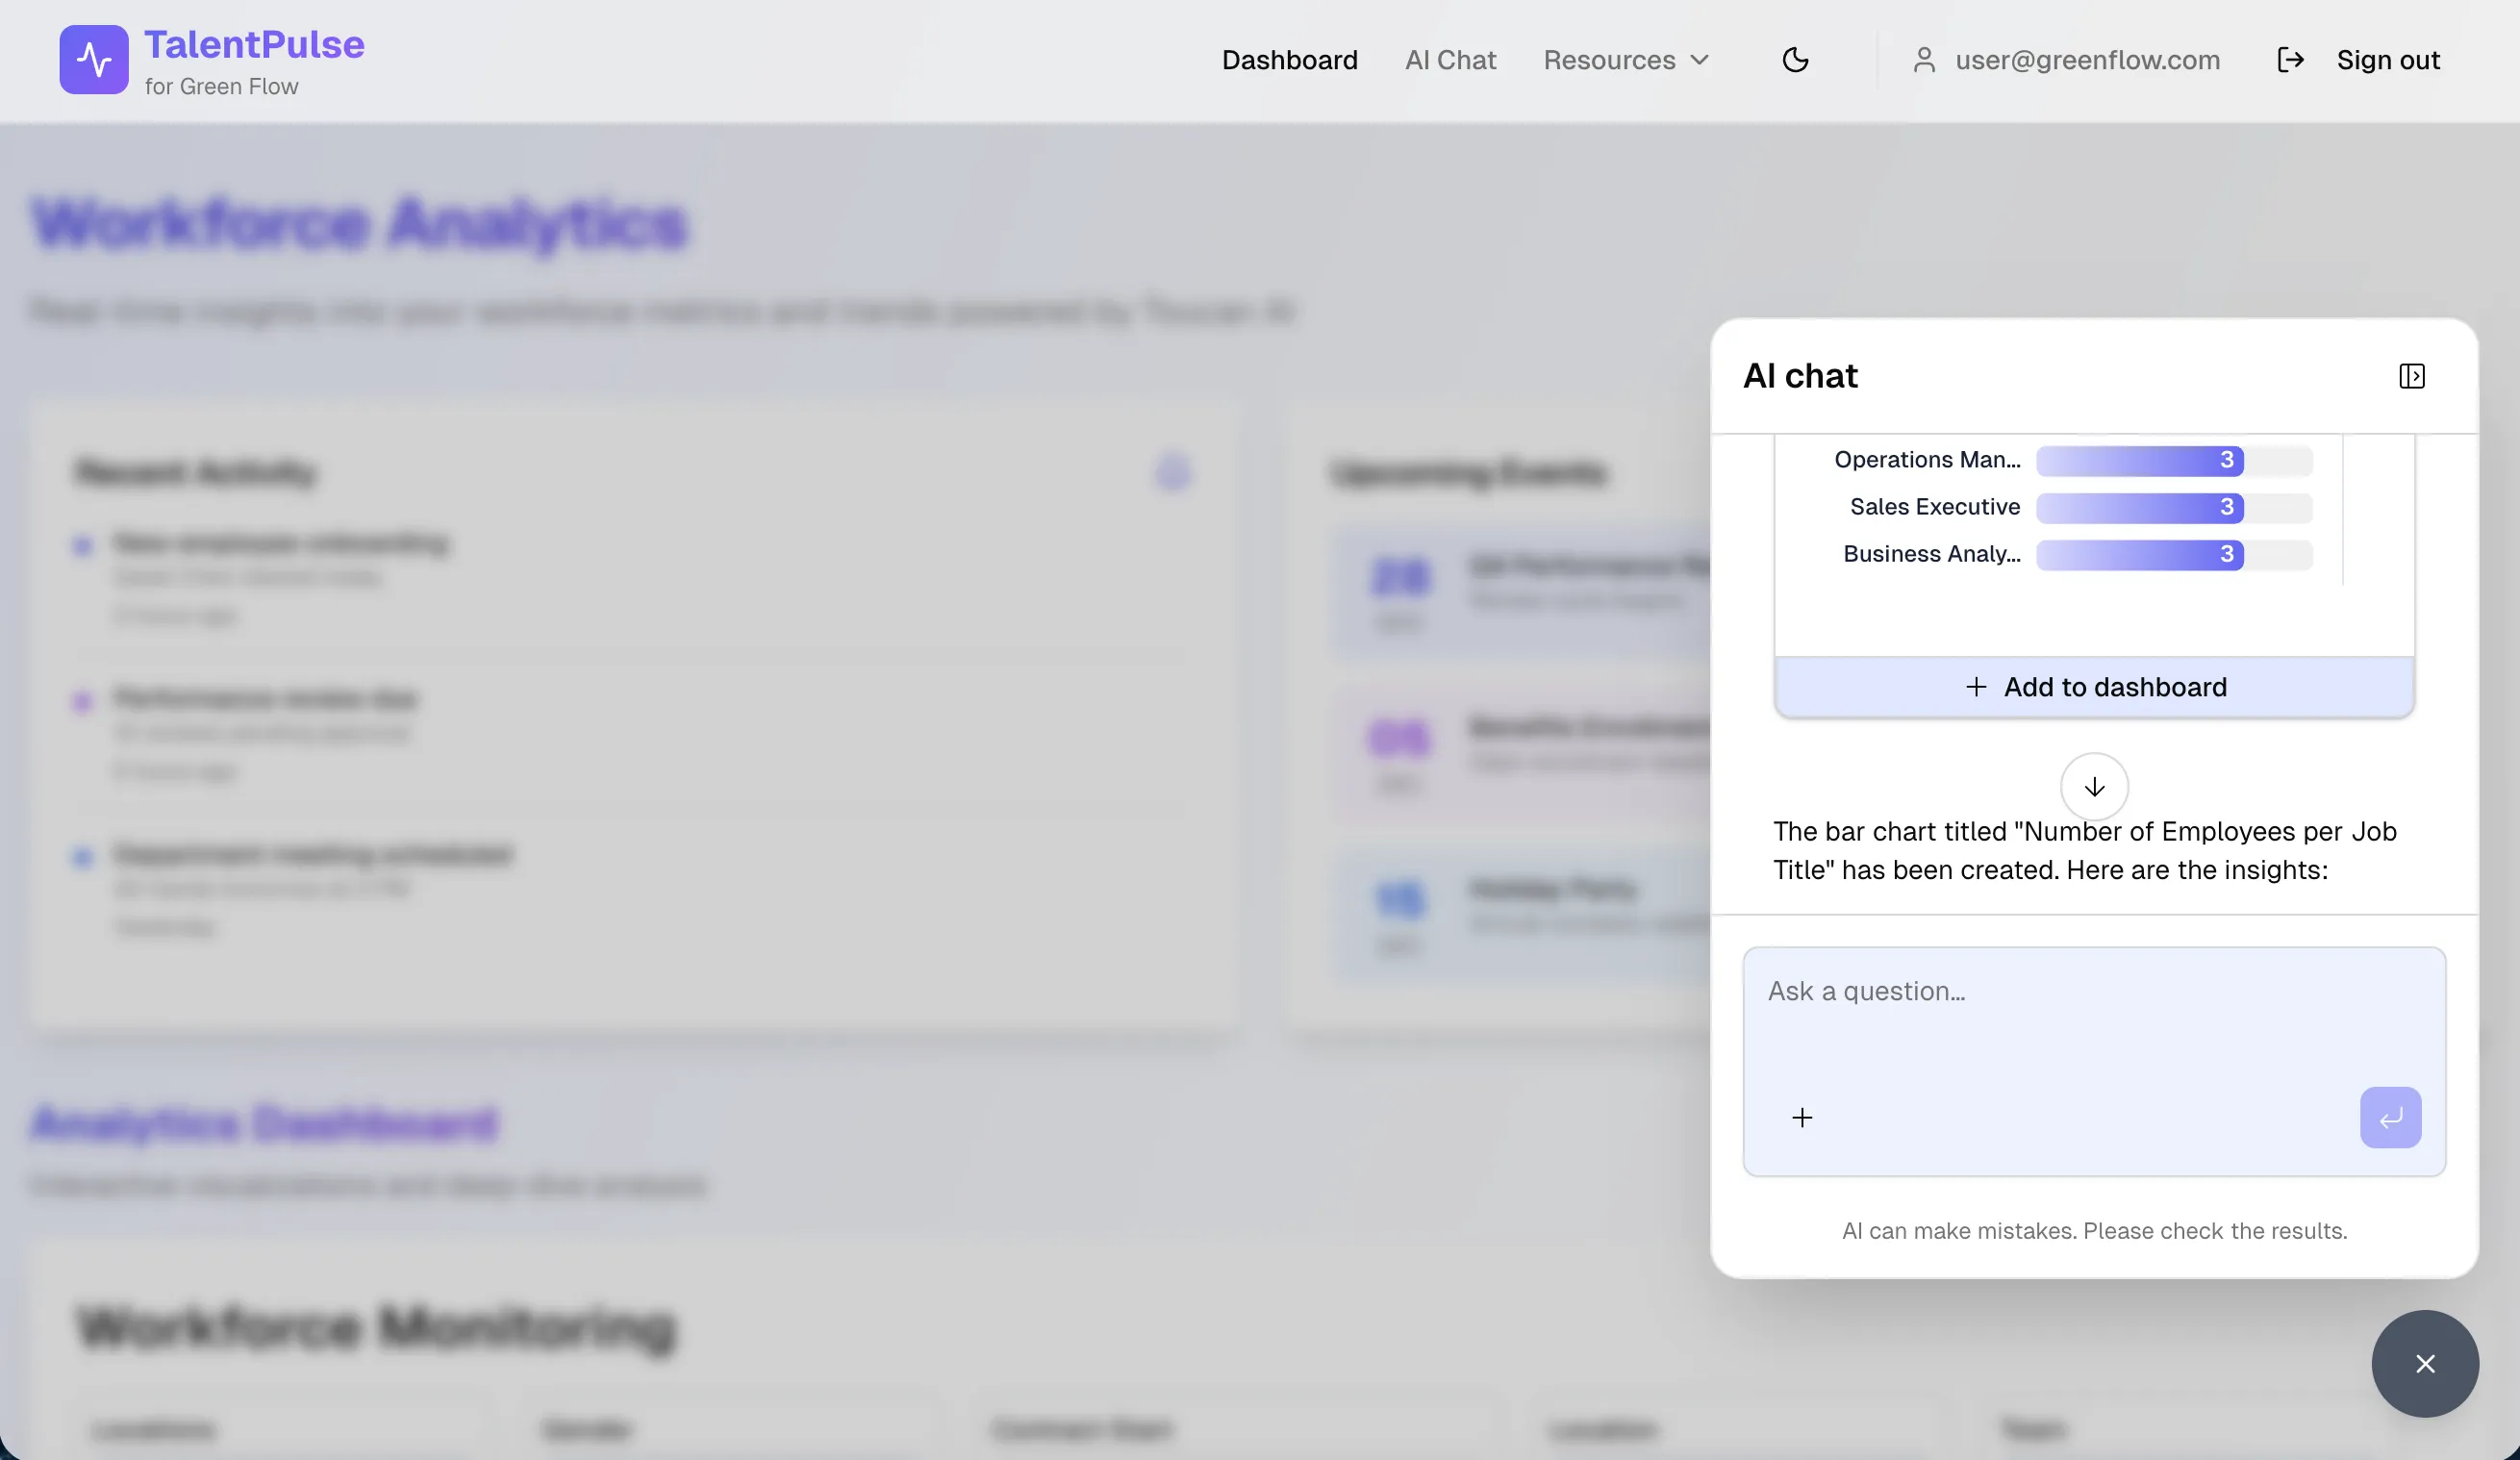
Instead of navigating dashboards, end users simply ask questions in natural language and instantly receive clear, reliable answers, complete with charts and narrative. Toucan handles all the underlying complexity: data connections, semantic layer, query generation, chart formatting, and enterprise-grade security.
My Role
Senior Product Manager, responsible for the chart and dashboard creation experience within Toucan AI. Working with my squad, my focus spanned both sides of the product: the maker experience (how builders create and edit charts and dashboards in an AI-native environment) and, above all, the end user experience. Ensuring that asking a question and instantly receiving a relevant, accurate chart would feel as simple and natural as possible.
The Problem
The market shift
By mid-2025, the pressure was undeniable: AI giants were entering every vertical, competitors were shipping AI features at speed, and end users shaped by tools like ChatGPT expected conversation-first experiences.
The old analytics paradigm (click, navigate, analyze) was becoming obsolete. 81% of users now prefer asking a question over navigating charts. SaaS companies without a credible AI analytics offering faced harder sales, higher churn, and mounting pressure from both clients and investors.
The product challenge
Rebuilding around conversational AI raised a fundamental design question: how should users create and edit charts in an AI-native product?
Giving full control to AI risked frustrating power users. Keeping a purely manual editing experience would defeat the purpose of going AI-native. The right answer was somewhere in between, and it wasn't obvious.
Approach & Key Decisions
Designing for complementary modes
Through user testing, a clear pattern emerged: there is no single "right" way to work with AI in analytics. Users defaulted to different behaviors depending on their profile and context.
A typical PM would use AI to kickstart a chart or dashboard, then switch to manual editing to fine-tune the result. A more technical user might prefer to go directly into code mode for precision. Some users never left the AI interface at all.
This insight led to a key product decision: rather than forcing a single interaction model, we designed three complementary editing modes (AI, manual, and code), allowing each user to work the way that felt most natural to them. The challenge was making these three modes feel like one coherent experience, not three separate tools stitched together.
Designing for trust in AI
Embedding AI into a product used for business decision-making raised a specific UX challenge: how do you make users trust an AI answer when the stakes are real?
Analytics are inherently high-stakes. A wrong chart or a misinterpreted metric can lead to poor business decisions. Generic AI responses were not enough.
To address this, we designed the conversational experience around transparency. Rather than just surfacing an answer, the product exposes its reasoning at every step: which data table was selected and why, which transformation steps were applied, and why a specific chart type was chosen to represent the data. This "chain of thought" layer gave users the context they needed to validate AI outputs with confidence, not just accept them blindly.
The probabilistic challenge
One of the broader challenges the team had to navigate was a fundamental tension at the heart of the product: analytics is a deterministic domain, but AI is probabilistic by nature. Users expect exact, reproducible answers from data. AI cannot always guarantee that.
This made evaluation a critical and complex challenge. Ensuring that the AI's answers were not just plausible, but reliably accurate. While the solution was primarily an engineering and ML challenge, it shaped how we framed requirements and set user expectations throughout the product experience.
The Solution
A conversational analytics experience embedded directly into SaaS products. End users simply ask a question in natural language and instantly receive the answer: a key figure, a chart, or a breakdown, with no technical knowledge required. For those who want to go further, the interface also supports manual editing and code mode, so every profile can work at their own level of depth.
Business Impact
qualified commercial opportunities generated by the beta launch in its first month.