Self-service Dashboard
Toucan enables SaaS product teams to embed fully customizable, white-label analytics into their applications in days, not months. This allows teams to stay focused on their core product while Toucan takes care of the analytics experience.
My Role
Senior Product Manager. I led this initiative end-to-end, from discovery to delivery, working closely with a Lead Engineer and a Product Designer. I was responsible for framing the problem, defining the product strategy, making prioritization calls, and ensuring we shipped fast enough to unlock business impact.
The Problem
The absence of a self-service offering represented a significant amount of lost revenue every year. For most of our prospects, self-service was a non-negotiable prerequisite to even consider Toucan, making it a critical acquisition blocker.
"As a B2B SaaS, I need a self-service layer in my product so that admin users can build their own dashboards with a simple, point-and-click experience, without depending on my team."
Toucan prospect, 2025
Self-service had been one of our most recurring requests from prospects, and its absence had been causing us to regularly miss deals.
Three distinct user needs
Through customer interviews, we identified three segments with different expectations:
want to browse and select charts from an existing library
want to edit and create charts themselves
want to edit the underlying data
Use cases
I can only view the dashboard my vendor has set up. If I need something specific, I have to submit a request and wait. I can't iterate on my own.
I have to handle every customization request manually. I lose time on specific developments, and I have no way to monetize these new options.
Approach & Key Decisions
Building self-service on top of a decade-old product came with real constraints: significant UX debt, a complex technical foundation, and no room for a long delivery cycle.
Speed over completeness
Rather than trying to serve all three user segments at once, we made a deliberate call to address the first two thirds of the demand first.
We built a pick-and-choose experience: end users can browse a chart library curated by their admin, and select what they want with a simple, point-and-click interface. No technical or data expertise required. This covered the most common use cases immediately, without the complexity of a full self-service editor, and got us to market fast enough to start winning deals.
Rebuild or adapt?
The ideal path would have been a full redesign of the dashboard creation and editing experience. The existing one carried years of accumulated complexity and technical debt. But a full rebuild would have taken too long, and our primary goal was to equip the Sales team as fast as possible.
We chose a pragmatic approach: working within the constraints of the existing experience, making targeted improvements, and accepting deliberate compromises. This allowed us to ship a first version significantly faster, without betting everything on a lengthy redesign cycle.
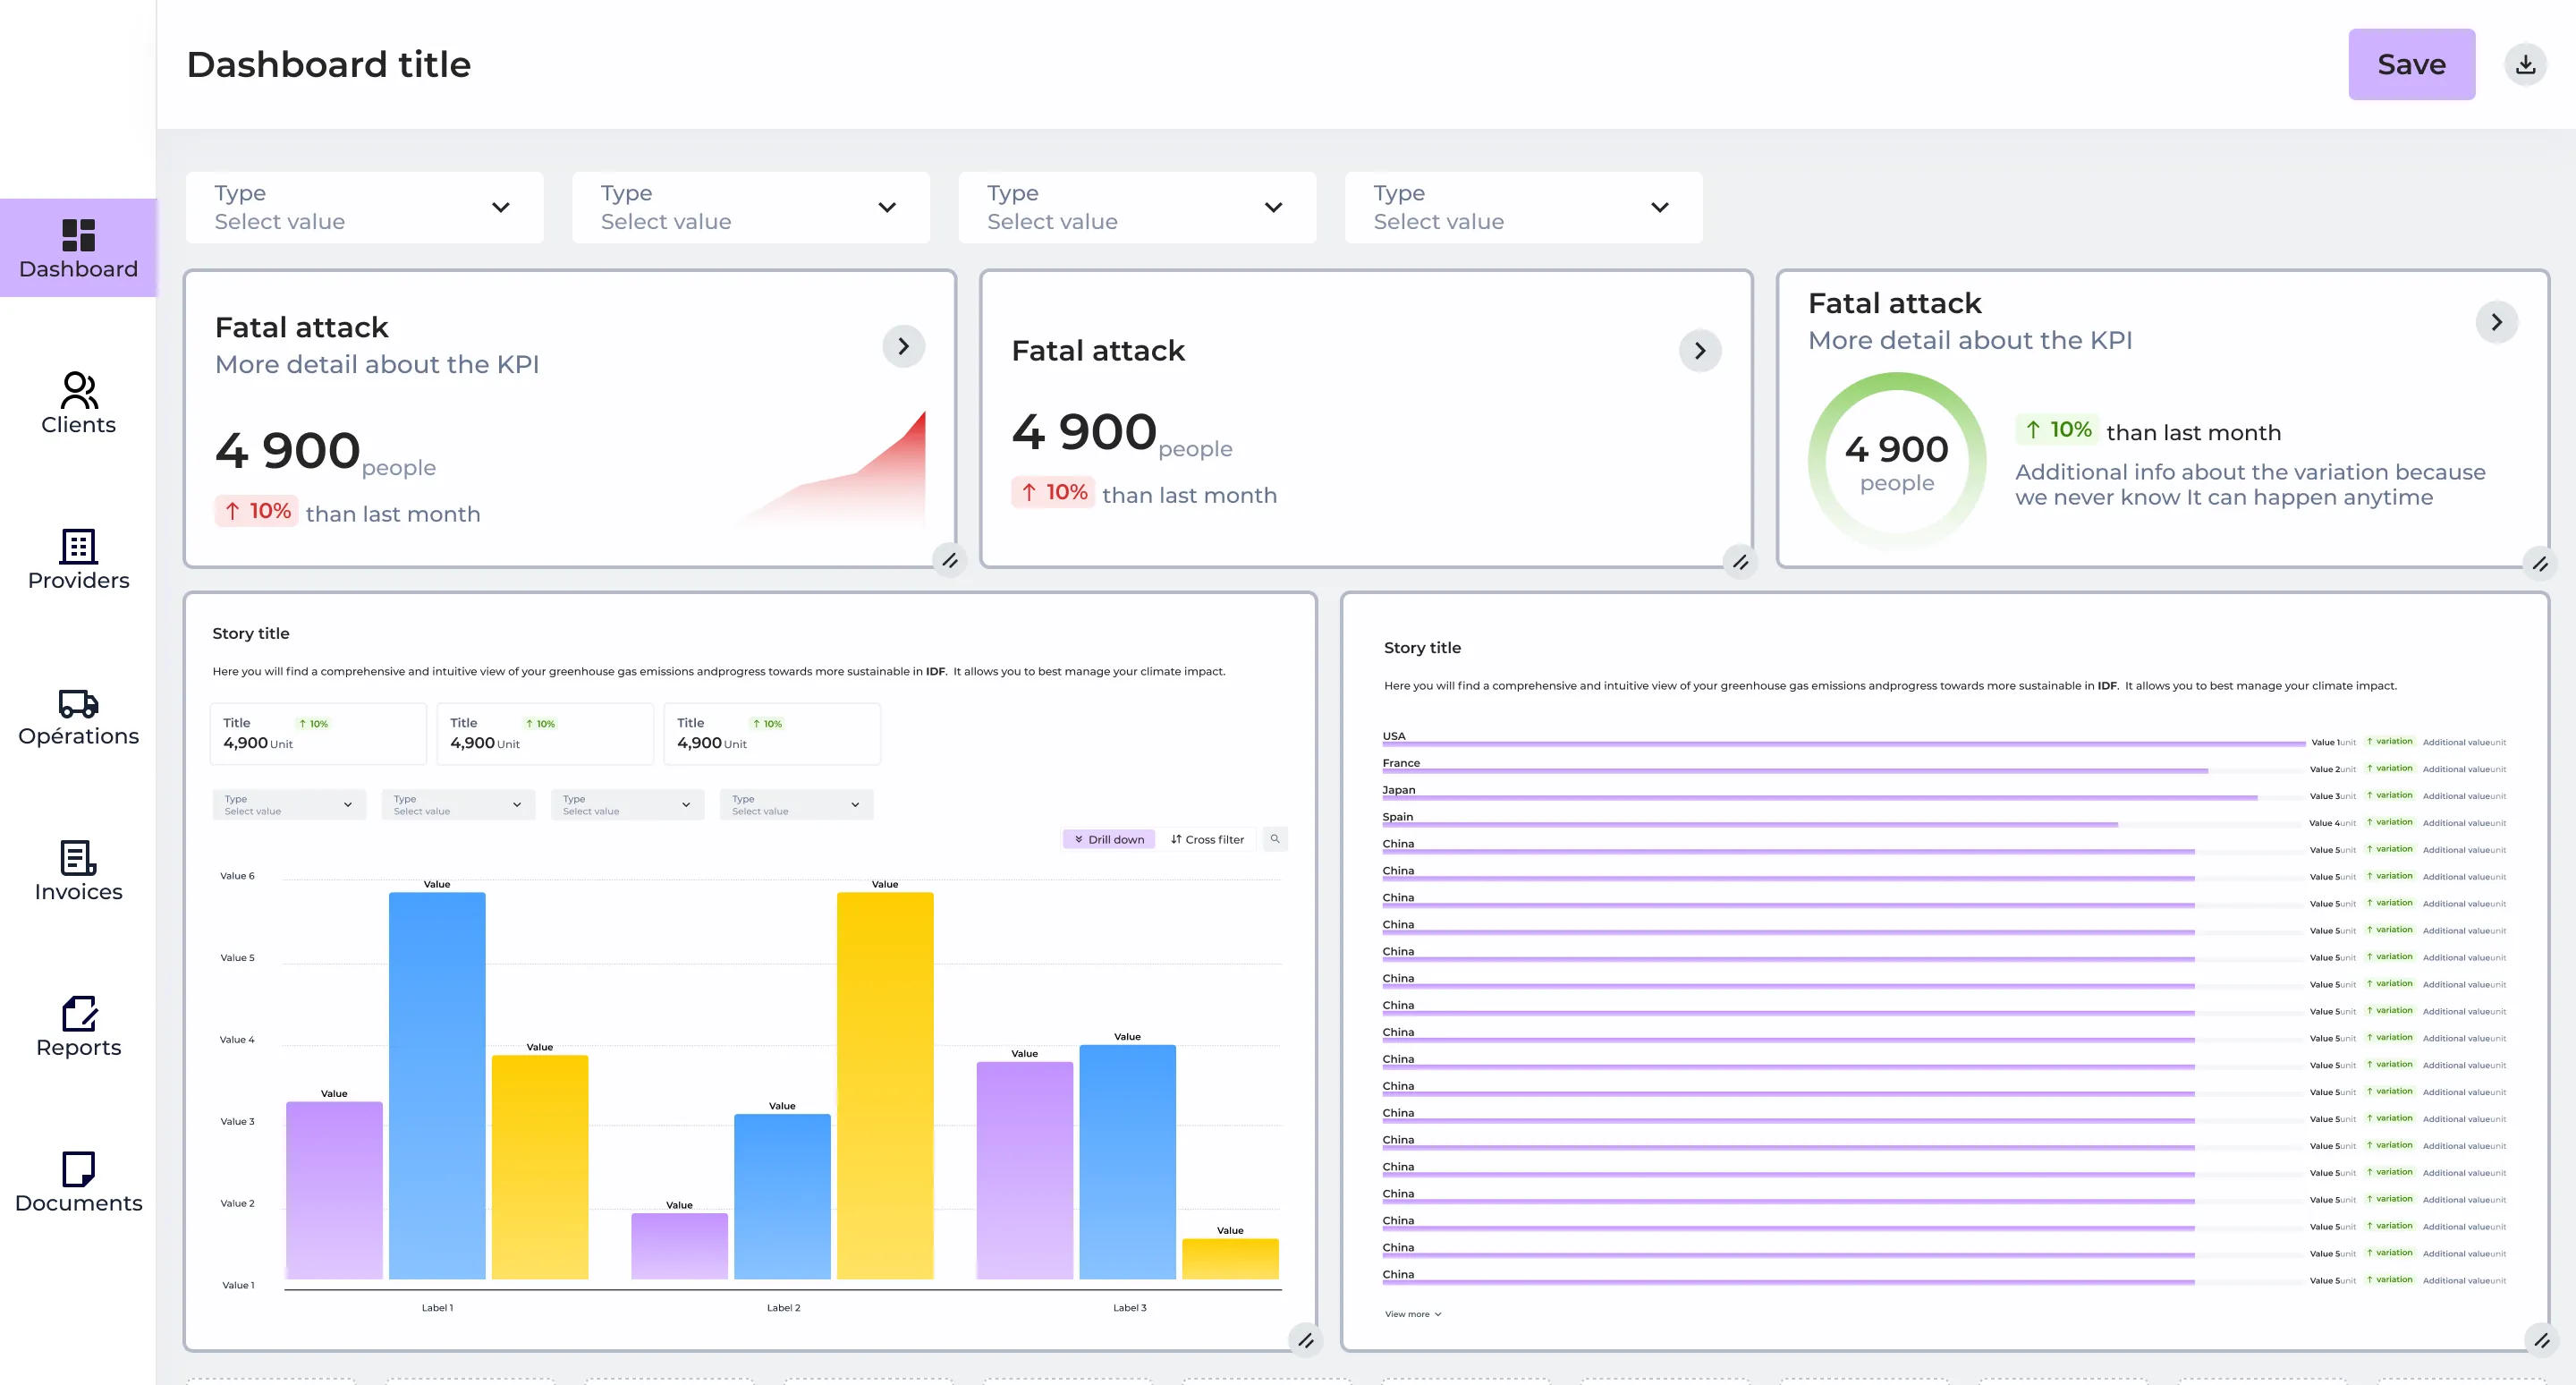
The Solution
A pick-and-choose dashboard editor that lets business users customize their embedded analytics experience without any technical knowledge. Admins define the chart library; end users build their own views from it, independently.
Business Impact
increase in SQL-to-QSO conversion in 2025, one of the most impactful features delivered that year.
clients adopted self-service since launch.